Description
Question 1 1 pts
Edit this QuestionDelete this Question
Use Excel or another software to draw the scatter plot for the variables. You can either upload the file or copy the scatterplot into the text box for your answer.
The director of an alumni association for a small college wants to determine whether there is any type of relationship between the amount of an alumnus's contribution (in dollars) and the years the alumnus has been out of school. The data follow.
| Years x | 1 | 5 | 3 | 10 | 7 | 6 |
| Contribution y | 500 | 100 | 300 | 50 | 75 | 80 |
Question 2 1 pts
Edit this QuestionDelete this Question
Compute the correlation coefficient between hourly wage and years of service. Rounded to the nearest thousandths. Compare it to the answer of a previous question.
| years of service x | 0.5 | 1 | 1.75 | 2.5 | 3.0 |
| hourly wage y | 9.51 | 8.23 | 10.95 | 12.70 | 12.75 |
Question 3 1 pts
Edit this QuestionDelete this Question

Based on the scatterplot above, the correlation between process input and quality characteristic is
Question 4 1 pts
Edit this QuestionDelete this Question

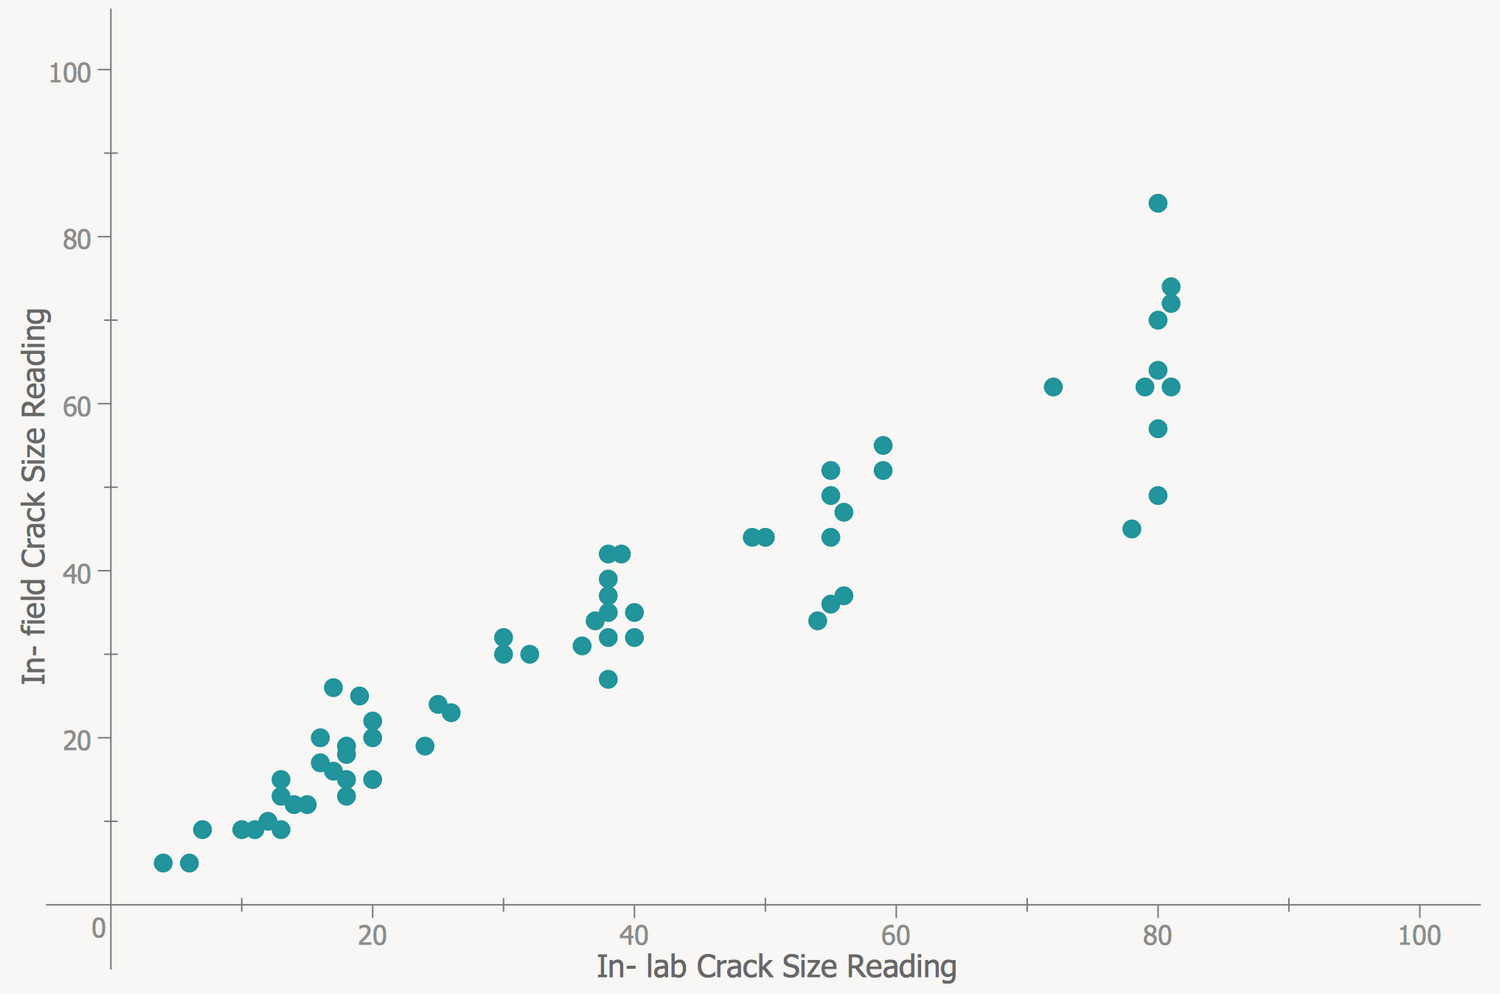
Based on the scatterplot above, the correlation between in-lab crack reading and in-field crack reading is
Question 5 1 pts
Edit this QuestionDelete this Question

What is the value of variable 2 if variable 1 is equal 8?
Question 6 1 pts
Edit this QuestionDelete this Question
Correlation coefficient between the left and right foot was computed and it was found to be 0.896.
If a patient's left foot is cooler than the average, then the patient's right foot is expected to be than average.
Question 7 1 pts
Edit this QuestionDelete this Question
On Canvas, in session about Correlation and Regression you can find the file "How to test for correlation". Use the data below to evaluate test statistic described there. Round your answer to the nearest thousandths.
cost of pizza 0.15 0.35 1.00 1.25 1.75 2.00
subway fare 0.15 0.35 1.00 1.35 1.50 2.00
Question 8 1 pts
Edit this QuestionDelete this Question
Using the test describe in "How to test for correlation" (see question above), test the null hypothesis if n=12, t=3.1, Choose the right conclusion.
a) There is not enough evidence at the α=0.01 level to conclude that there is a linear relationship in the population between the predictor x and response y.
b) there is sufficient evidence at the α=0.01 level to conclude that there is a linear relationship in the population between the predictor x and response y
c) there is not enough data to draw any conclusion
Question 9 1 pts
Edit this QuestionDelete this Question
Using the test describe in "How to test for correlation" (see question above), test the null hypothesis if n=12, t=3.3, Choose the right conclusion.
a) There is not enough evidence at the α=0.01 level to conclude that there is a linear relationship in the population between the predictor x and response y.
b) there is sufficient evidence at the α=0.01 level to conclude that there is a linear relationship in the population between the predictor x and response y
c) there is not enough data to draw any conclusion
Question 10 1 pts
Edit this QuestionDelete this Question
If all data points on its scatter plot are on one line, then the correlation coefficient is equal
Question 11 1 pts
The following are data with the correlation coefficient equal negative one (-1). Find the missing entry in the data.
x 4 5 6
y -8 -10 ?
Question 12 1 pts
Is the following conclusion drawn after finding that there is a significant correlation between annual personal income and years of education true?
Conclusion: More education causes a person's income to rise.

Explanation & Answer

Scatterplot from question 1
Years x
Contribution y
1
500
5
100
3
300
10
50
7
75
Scatterplot
Alumnus's contribution ($)
600
500
400
300
200
100
0
0
2
4
6
8
Years the alumnus has been out of school
10
6
80
12
Question 2. Correlation coefficient between hourly wage and years of service. Rounded to the nearest thousandths.0.906
Question 3Based on the scatterplot above, the correlation between proc...


